


UK companies in the Mature lifecycle phase i.e. 10-15 year olds return the best annual operating margins.
Visit OODUTTY to find out more about UK companies, directors, benchmarks and metrics
The chart below shows the UK companies in each lifecycle phase (Start-up, growth, mature and established) along with benchmark metrics for Revenue, Operating Profit and Operating Margin for 2013. Use the filter buttons to review data by Lifecycle and Yearend. Revenue and Operating profit figures are in GBP.
At OODUTTY we transform Big Data through the intelligence scale from micro to macro levels
|
Limitations of UK companies benchmarks
|
|---|
| Revenue disclosure is not mandatory for small companies submitting abridged accounts. Hence the Revenue benchmark may only be reliable for Established lifecycle phase and listed companies |
| Calculations are based on the average results of companies whose financial year-ends fall within the benchmark calendar year |
| Calculations exclude annual accounts not filed electronically with Companies House i.e. approximately 35-40% |
| Calculations for Year-to-date and the immediately preceding year benchmarks will change in response to new filings at Companies House since there’s 12-18 month time lag between then end of a company’s financial year end and the filing of annual accounts with Companies House. |
| UK unlisted private company accounts use historical cost reporting |
As at the end of January 2015, UK start up and growth companies made up approximately 84% of actively trading companies.
Visit OODUTTY to find out more about UK companies, directors, benchmarks and metrics
The chart below shows the UK companies in each lifecycle phase (Start-up, growth, mature and established) along with benchmark metrics for Revenue, Operating Profit and Operating Margin for 2013. Use the filter buttons to review data by Lifecycle and Yearend. Revenue and Operating profit figures are in GBP.
At OODUTTY we transform Big Data through the intelligence scale from micro to macro levels
|
Limitations of UK companies benchmarks
|
|---|
| Revenue disclosure is not mandatory for small companies submitting abridged accounts. Hence the Revenue benchmark may only be reliable for Established lifecycle phase and listed companies |
| Calculations are based on the average results of companies whose financial year-ends fall within the benchmark calendar year |
| Calculations exclude annual accounts not filed electronically with Companies House i.e. approximately 35-40% |
| Calculations for Year-to-date and the immediately preceding year benchmarks will change in response to new filings at Companies House since there’s 12-18 month time lag between then end of a company’s financial year end and the filing of annual accounts with Companies House. |
| UK unlisted private company accounts use historical cost reporting |
Turnover in mining, oil and gas sectors in 2013 was £1.25 trillion or 67.7% of the FTSE 100 market cap of £1.8 trillion.
Filter on the Mining and Oil and Gas market sectors to review results.
You can purchase the full spreadsheet using the link below. This product contains approximately 40 data-points for each FTSE 100 company covering the latest 5-year financial results published prior to 28 November 2014.
We have chosen 2013 since it’s expected that the majority of companies would have filed their full year results as at the end of November 2014.
The extended dataset of approximately 40 financial data-points for companies covered in FTSE 100 list is available to purchase for £100. This product will be supplied as an Excel spread-sheet.
The extended dataset covers a 5-year reporting period in most cases, apart from recently listed companies such as Royal Mail Group (RMG).
To discuss other bulk data options please contact sales@oodutty.com.
Source:
FTSE 100 companies financial metrics for 2013 financial year and 2012 comparatives.
London Stock Exchange (LSE) market sectors
LSE Market capitalisation is at 28-Nov-2014
Powered by: OODUTTY.COM
Consolidated financial results of the FTSE 100 companies for the year 2013 show that companies in the Mining, Oil and Gas market sectors account for over 55% of the index total revenue.
Filter on the Mining and Oil and Gas market sectors to review results.
You can purchase the full spreadsheet using the link below. This product contains approximately 40 data-points for each FTSE 100 company covering the latest 5-year financial results published prior to 28 November 2014.
We have chosen 2013 since it’s expected that the majority of companies would have filed their full year results as at the end of November 2014.
The extended dataset of approximately 40 financial data-points for companies covered in FTSE 100 list is available to purchase for £100. This product will be supplied as an Excel spread-sheet.
The extended dataset covers a 5-year reporting period in most cases, apart from recently listed companies such as Royal Mail Group (RMG).
To discuss other bulk data options please contact sales@oodutty.com.
Source:
FTSE 100 companies financial metrics for 2013 financial year and 2012 comparatives.
London Stock Exchange (LSE) market sectors
LSE Market capitalisation is at 28-Nov-2014
Powered by: OODUTTY.COM
As at 30 September 2014, annual accounts for UK companies reveal that those registered in England and Wales held over 94% of cash and bank balances as compared with under 5% for companies registered in Scotland.
UK Companies Key Performance Indicators (KPI’s) can be visualized here.
UK Company Accounts – 2014 YTD filings can be visualized here
UK companies have reported over £51 billion in cash and bank balances for the calendar year 2013, as at 30 September 2014. The main question is will this figure be exceeded when all the annual accounts relating to the 2014 calendar year are filed.
In general there’s an average 12-month time lag between a company’s financial year end and its accounts being filed at Companies House. As such, estimates of the full year figures for calendar year 2013 are provisional and will only be reliable after Q4 2014. Similarly, for calendar year 2014, reliable estimates can only be made after Q4 2015.
View the full story on our data visualization page – Accounts->Sep 2014 YTD
Quick facts – UK Companies financial metrics, calendar year 2014 YTD
Quick facts – UK Companies financial metrics, calendar year 2013 FY
Below are 4 key metrics selected from 620 account line descriptions that make up the full chart of accounts.
Further, the key performance indicators (KPI’s) compiled for these 4 metrics can be visualized by following this link.
OODUTTY.COM
1. Data mining utility generated 16.4 million account lines from 1.1 million annual accounts under 2 hours
2. DataManager visualisation tool for summarising and charting data is supplied free with all bulk data purchases
Contact sales@oodutty.com for further information.
Over 50% of UK companies file their annual accounts in Q3 and Q4 with September and December seeing the largest volumes.
UK company returns filed with Companies House during Q3 2014 revealed that 50% of assets were reported during the month of September!
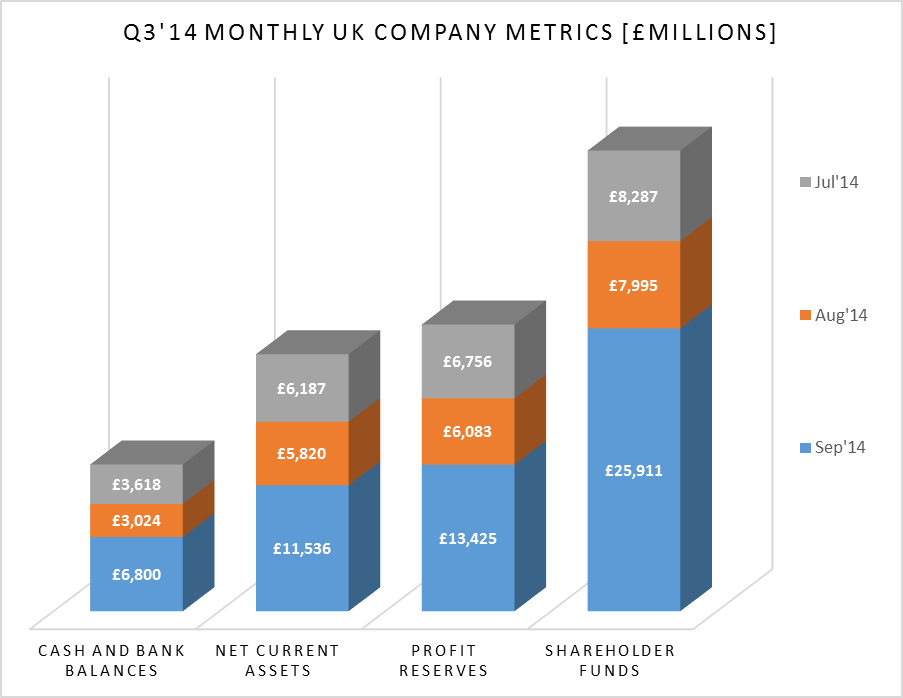


UK company financials (£m) consolidated – Q3 2014
| Account metric | Sep’14 | Aug’14 | Jul’14 | Q3 2014 |
| Cash and bank balances | £6,800 | £3,024 | £3,618 | £13,441 |
| Net Current Assets | £11,536 | £5,820 | £6,187 | £23,542 |
| Profit reserves | £13,425 | £6,083 | £6,756 | £26,264 |
| Shareholder funds | £25,911 | £7,995 | £8,287 | £42,193 |
Volume of UK company accounts processed – Q3 2014
| Account metric | Sep’14 | Aug’14 | Jul’14 | Q3 2014 |
| Cash and bank balances | 140,605 | 87,197 | 99,697 | 327,499 |
| Net Current Assets | 133,327 | 81,214 | 92,625 | 307,166 |
| Profit reserves | 130,650 | 79,720 | 91,166 | 301,536 |
| Shareholder funds | 159,702 | 99,747 | 113,052 | 372,501 |
•The data is normalized to exclude 2 companies who reported Cash Balance and Net Assets totally £269 billion: £169 billion in September and £100 billion in July 2014.
•Get the FREE Summary financial metrics for Sep 2014 from OODUTTY.COM store
•We are now offering OODUTTY Data Manager as a free visualization tool to group and chart the financial data. This free tool is available on bulk data purchases over £2,500
•Get our Q4’2014 Special bulk data offer of £0.50 or 50p per annual accounts for September 2014 account filings
•Delivery options include: ftp download, email, downloaded or DVD by special post
Email sales@oodutty.com for further information.
UK company accounts filed at Companies House during Q3 2014 reported cash and bank balances of £13.4 billion which represents 57% of net current assets and 32% of shareholder funds or net assets.
| Account | Sep’14 | Aug’14 | Jul’14 | Q3’14 Total |
| Cash and bank balances | £6,800 | £3,024 | £3,618 | £13,441 |
| Net Current Assets | £11,536 | £5,820 | £6,187 | £23,542 |
| Profit reserves | £13,425 | £6,083 | £6,756 | £26,264 |
| Shareholder funds | £25,911 | £7,995 | £8,287 | £42,193 |
A visualization of Q3 2014 metrics relating to Cash and Bank Balances; Net Current Assets; Profit Reserves; and Shareholder Funds can be viewed here.
•The data is normalized to exclude 2 companies who reported Cash Balance and Net Assets totally £269 billion: £169 billion in September and £100 billion in July 2014.
•Get the FREE Summary financial metrics for Sep 2014 from OODUTTY.COM store
•We are now offering OODUTTY Data Manager as a free visualization tool to group and chart the financial data. This free tool is available on bulk data purchases over £2,500
•Get our Q4’2014 Special bulk data offer of £0.50 or 50p per annual accounts for September 2014 account filings
•Delivery options include: ftp download, email, downloaded or DVD by special post
Email sales@oodutty.com for further information.
